|
|
|
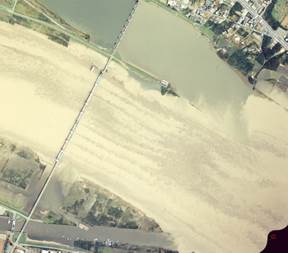
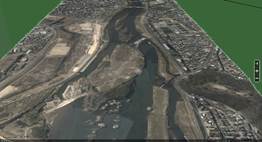
Aerial
photo, Tone River, Japan (September 17, 1998) |
|
|
|
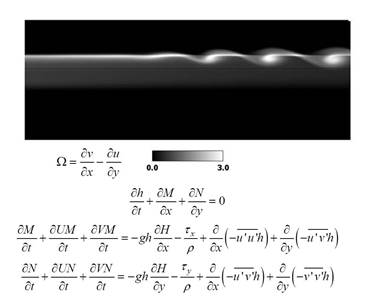
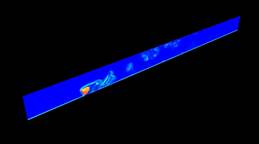
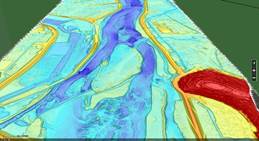
Horizontal
vortex in open-channel flows (CFD, shallow water model,contour
of vorticity) |
|
|
|
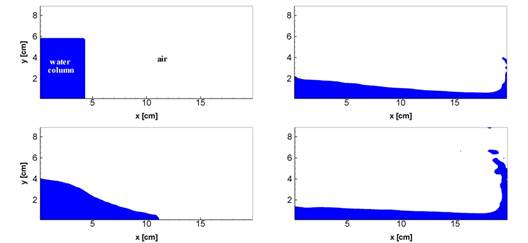
Dam-break
problem, simulated by the MARS method (blue: water column, background: air) |
|
|
|
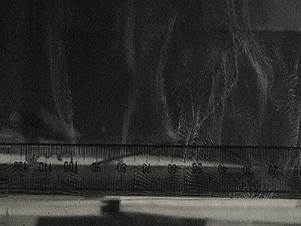
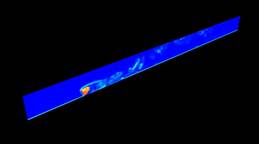
Organized
motions water flow near the free-surface in air-water co-current flows, visualized
by the hydrogen-bubble method |
|
|
|
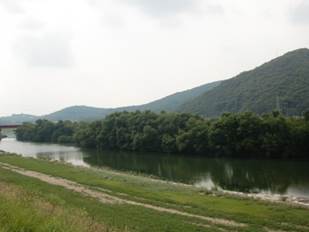
Lush
trees established on gravel bars in the lower reaches of the Asahi River, taken
at the left side of the 15 km upstream section from the river mouth in early
September, 2012 |
|
|
|
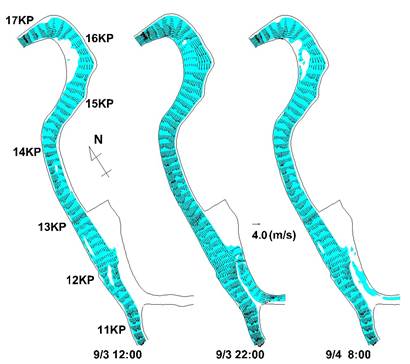
Numerical
results of the Asahi River flood flow in 2012 |
|
|
|
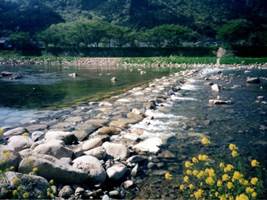
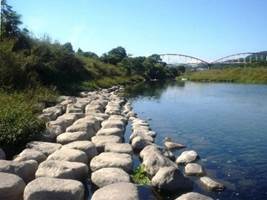
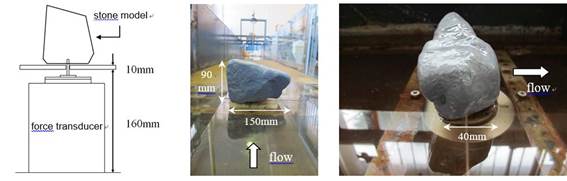
Hydraulic
structures Installed in rivers using natural stones (left: Maruyama
River, Japan; right: Fushino River, Japan). |
|
|
|
Installation
of the stone model in an experimental flume and a
force transducer fixed to the model |
|
|
|
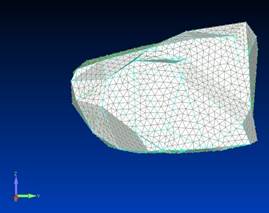
A segmented
stone model with multiple tetrahedron elements |
|
|
|
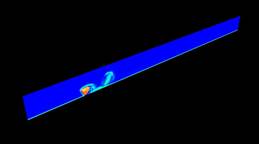
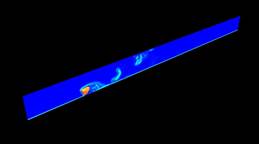
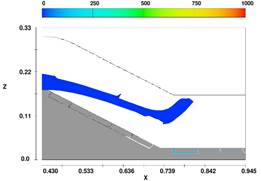
Simulation
results of instantaneous vorticity behind the stone model at the vertical cross-section;
upper left: 1.0s, upper right: 2.0s, lower left: 3.0s, lower right: 4.0s
(elapsed time from initial condition) |
|
|
|
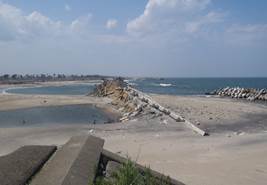
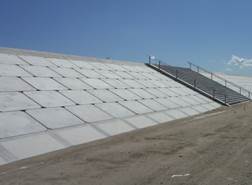
Typical scene of coastal dike failure at the
southern part of Sendai’s coast in Miyagi prefecture (left) and construction
example of the armored coastal dike using
concrete blocks |
|
|
|
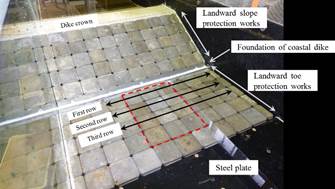
Figure 10 Flat block model for simulated coastal dikes (left), and landward slope protection works and landward toe protection works
in laboratorial experiments. |
|
|
|
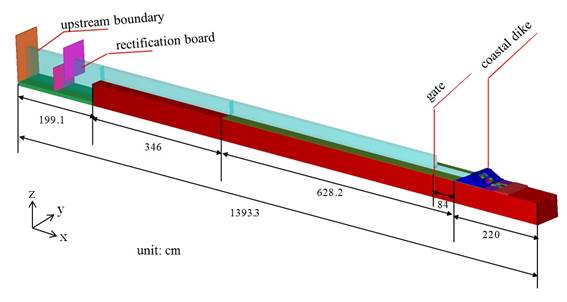
Overview of computation domain (upper), lateral length scale of the computation
domain (lower left), and multigrid system
using a nesting technique for simulations in the x–z
plane |
|
|
|
Comparison of time-series of simulation results of water depth
with experimentally obtained results at the top of landward slope of the simulated coastal dike |
|
|
|
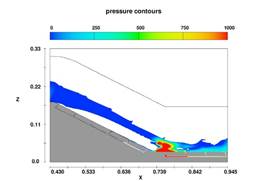
Numerical results of instantaneous water body and pressure
distribution using Flow3D |
|
|
|
ALB measurements made with lasers of two kinds in a river terrain
with overland and underwater areas |
|
|
|
An
aerial photo of the lower Asahi River (left) and corresponding bathymetry
contour map made by ALB measurement data |
|
|
|
Full-waveform ALB
point cloud scattered on both the trees and
river bed |
|
|
|
Aerial photograph taken on March 3, 2016 (left) and the
corresponding land use map (right) processed using ALB data around the
bifurcation point of the lower Asahi River |
|
|
|
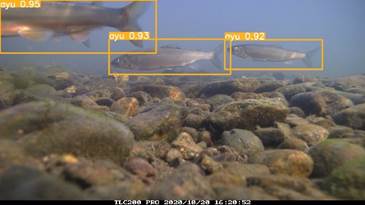
Ayu
detection using a deep learning technique (YOLOv5) for underwater camera
images in
the Asahi River around the Heidan area (10 KP) |
|
|
|
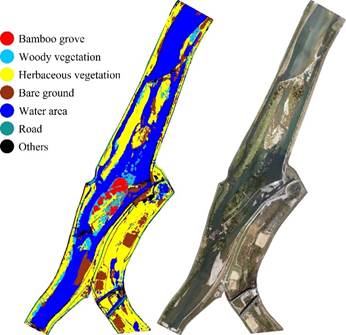
Land
cover classification using semantic segmentation (DeepLabV3+) for drone
images in the Asahi River reach around the
bifurcation point (12 KP) |
|
|
|
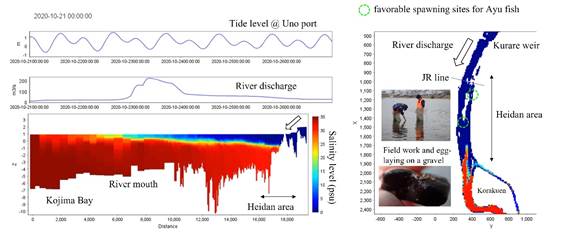
Investigation
of favorable spawning sites for Ayu fish in the Asahi River estuary, based on
a series of field work activities and numerical simulations (AEM 3D) on
environemtal factors |
|
|
|
|
|
|
|
|